
Here at Nightfall we ensure that we are always using the most appropriate technology and tools while building services. Our architecture involves serverless functions, relational and NoSQL databases, Redis caches, Kafka and microservices written in Golang and deployed in a Kubernetes cluster. To effectively monitor and easily troubleshoot our services, we use distributed tracing across our services.
In this blog post, we discuss the importance of distributed tracing and will go over an example of how we are going to implement distributed tracing with Datadog.
Introduction
With the microservice architecture, we now have interactions that cover several services. Each service completes some work (ex, database query, HTTP request). This makes debugging and troubleshooting harder, as it takes more time to determine which services interacted with each other and what work was done by each service.
An example of a troubleshooting exercise that would be easier with distributed tracing has the following sequence of service interactions:
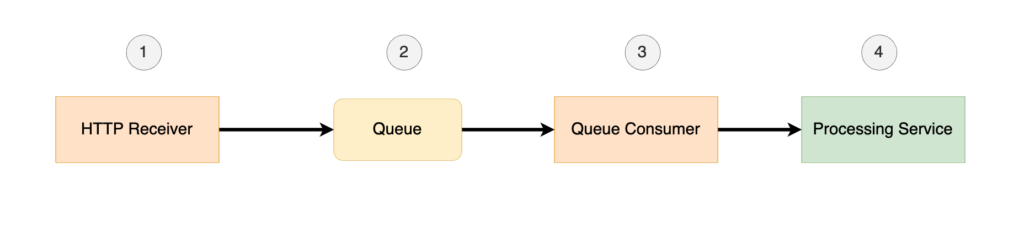
The sequence is a pipeline implemented for receiving HTTP requests. We can see that a single request would traverse through four different stages consisting of two serverless functions (#1 & #3 above) which produce and consume from a queue, a queue (#2) and a processing service (#4).
In such a sequence, there are many different ways in which an HTTP request can fail to be processed. Troubleshooting a failed request would involve checking the logs of each individual component of the pipeline. Did the HTTP Receiver (#1) fail silently? Did the request get produced to the queue? Did the Queue Consumer (#3) fail to receive a message from the queue? Does the Processing Service (#4) have a bug causing certain requests to fail?
Even after looking through the logs for each component it can still not be clear where the request failed. We could add verbose logging to each component, but this would be time consuming and would later produce too much noise in the logs.
With distributed tracing, the request can be traced through all the components of the pipeline. A request being successfully processed would be a single trace which contains all four components of the pipeline, showing that the request traversed through all components. An example of a failure would be a single trace which only shows three of the components. For that failure, we would see from the trace that the request made it to the Queue Consumer and then failed. So we know the issue must be occurring in the Queue Consumer. At this point, we would have narrowed down the issue and can dig deeper into the component to identify the cause of the issue.
Tracing and spans
A span is a piece of work done by a service. Spans can have relationships to other spans, such as parent and child. Multiple spans along with their relationships create a trace. The trace will represent a group of service interactions and all the work done by each service.
As a simple example, let's say that I have an endpoint /do on a service which will make an HTTP request to an external 3rd party and store the response in a database. The spans would have the following relationships:
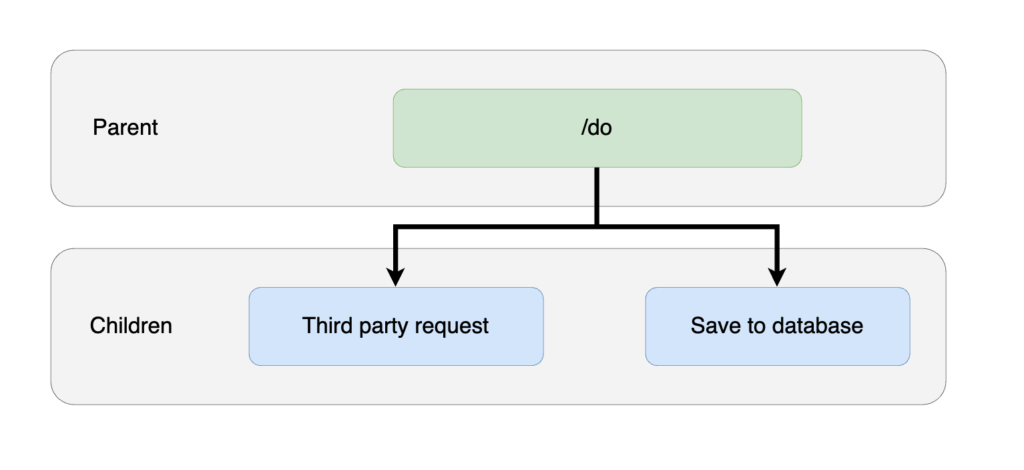
Here the root span is for the request to the endpoint /do. The root span has two child spans, one is a request to a third party service and another to save the data to a database.
With distributed tracing we end up with a single trace with multiple spans across all the services involved. This enables us to understand how all the services interact with each other.
Example Implementation
We are going to implement distributed tracing on an example in Golang and will send our traces to Datadog where we will be able to view them.
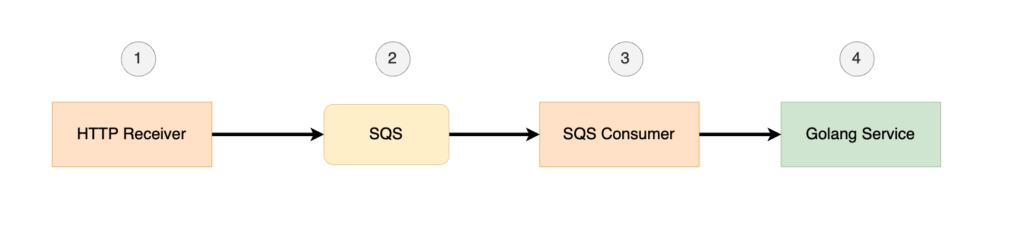
In our example, we have AWS Lambda functions, AWS SQS and a Golang service. The first AWS Lambda accepts HTTP requests and produces messages into SQS. The second AWS Lambda consumes from SQS and sends an HTTP request to the Golang service. This service does some processing and then the trace is completed:
AWS Lambda Functions
We first need to instrument our AWS Lambda functions with the ability to send traces to Datadog. First we need to add a layer to our Lambda function. This Datadog layer will be responsible for sending the spans to Datadog.
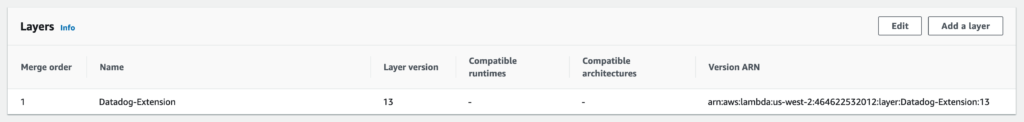
Create a new layer for your Lambda functions and add the layer by specifying an ARN:

The new layer should appear in the layers section of the Lambda function in the AWS console:
For more details about installing AWS Lambda monitoring, check the Datadog documentation.
For this Datadog layer to properly send spans to Datadog we need to:
- Add an API key to each Lambda's environment variables under the key DD_API_KEY.
- Wrap our Lambda function in a Datadog function that will automatically create and inject a span into our Lambda function. This is shown in below code snippet:
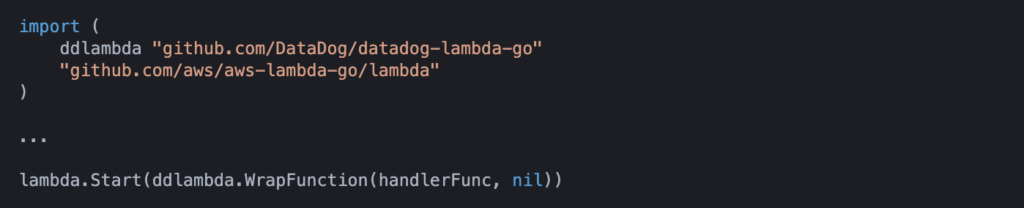
Now that we have our Lambdas setup with Datadog we are able to have these functions send spans to Datadog:
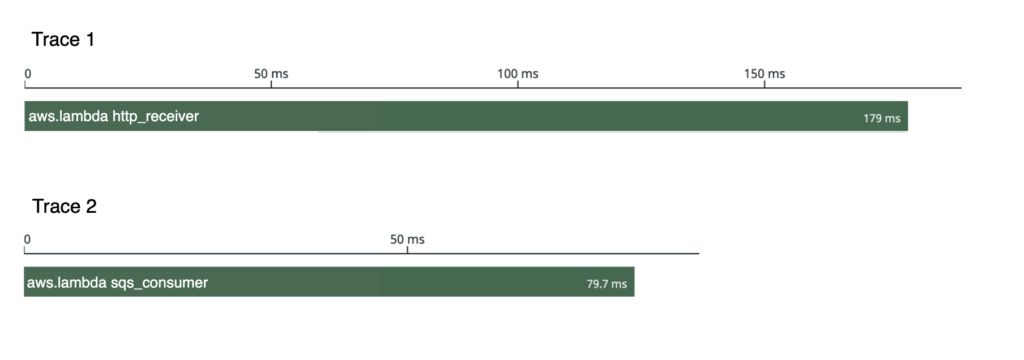
Now we have two independent traces! However to ease troubleshooting, we need to combine them into a single trace.
Passing Spans Through SQS
Fortunately Datadog allows us to inject and extract spans from a struct that can then be passed around between services as long as the struct implements an interface. The interface that allows for the ability to inject spans into our struct is as follows:
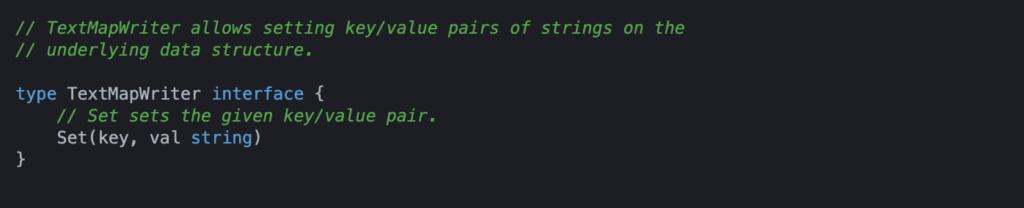
So we will need to have the HTTP receiver Lambda inject its span into the message that it then sends to the consumer Lambda via SQS. We will do so using the Inject(...) function provided by the Datadog library.
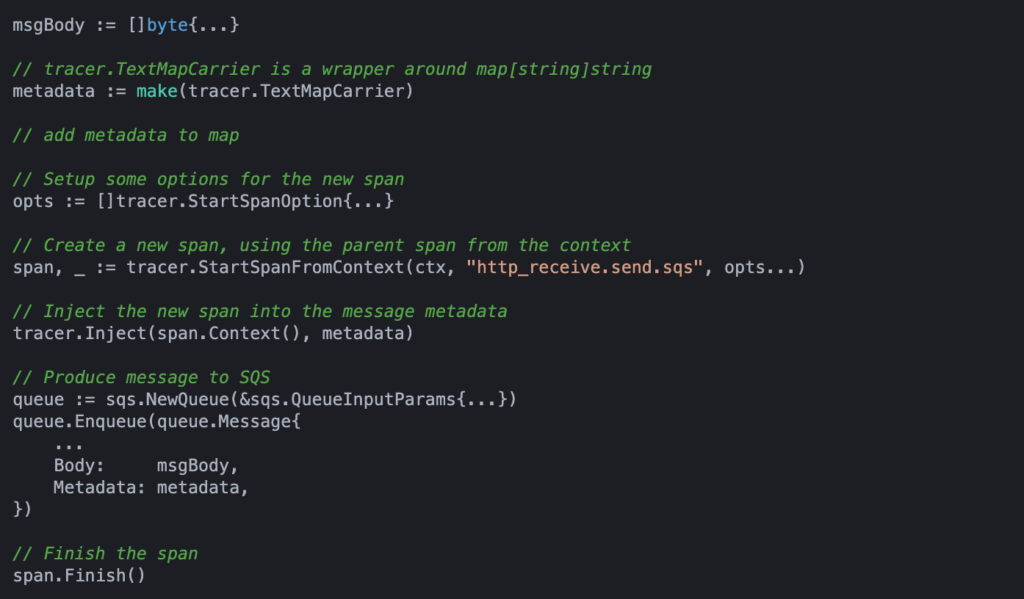
Datadog has already created a type tracer.TextMapCarrier which is a wrapper around the type map[string]string. The metadata that we send along with a SQS message is a map of this type so it is straightforward to inject the span.
Before injecting the span into our metadata we want to extract the parent span of the Lambda function. This will allow us to create a new child span to be sent through SQS to the consumer Lambda. The parent span is already in the context of the Lambda function since ddlambda.WrapFunction automatically injects a span into the function context for us:
Now that we have injected a span into the SQS message we need to extract it on the consumer side. In order to be able to extract a span from target data it needs to implement an interface. The interface that allows for the ability to extract spans from a struct is as follows:
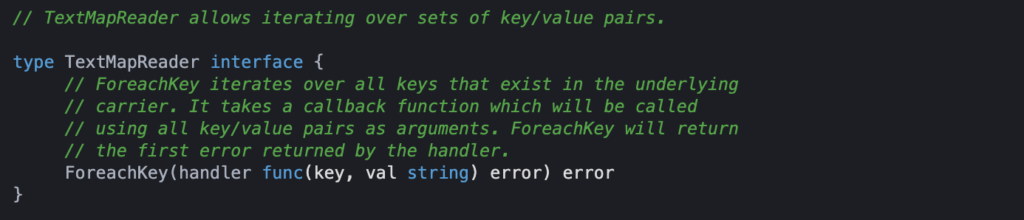
We have injected the span into the SQS message metadata. The metadata on the consumer side is of the type map[string]events.SQSMessageAttribute. To properly extract the span from this struct we need to create a wrapper that implements the TextMapReader interface:
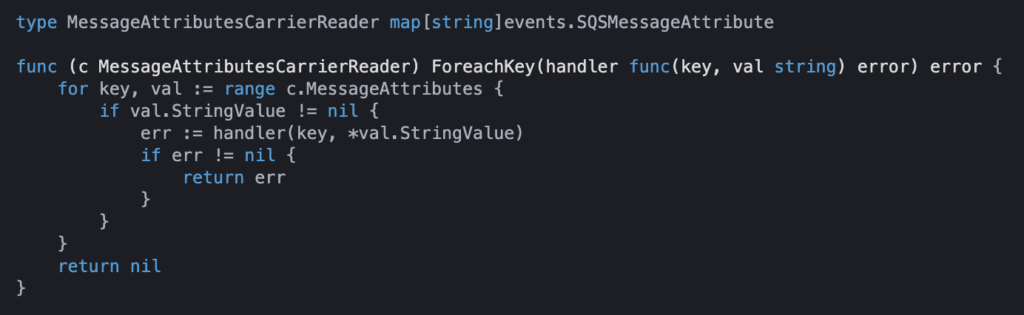
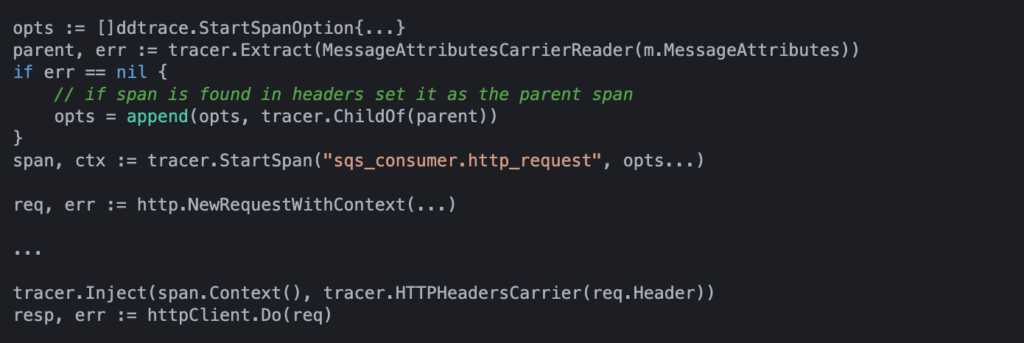
The wrapper is very simple and only deals with string values since the injected span is in the form of string key value pairs on the struct. We can now use this wrapper to extract the span from the SQS message, using the Extract(...) function:

This parent span can now be used to create children spans to continue the trace.
Passing Spans Through HTTP
The next step is for the consumer Lambda to send an HTTP request to our Golang service. We will continue the trace by creating a new span which is a child of the span we extracted from SQS. This span can be injected into the request header using the type tracer.HTTPHeadersCarrier. This type implements both interfaces for injecting and extracting spans and is a wrapper around the type http.Header:
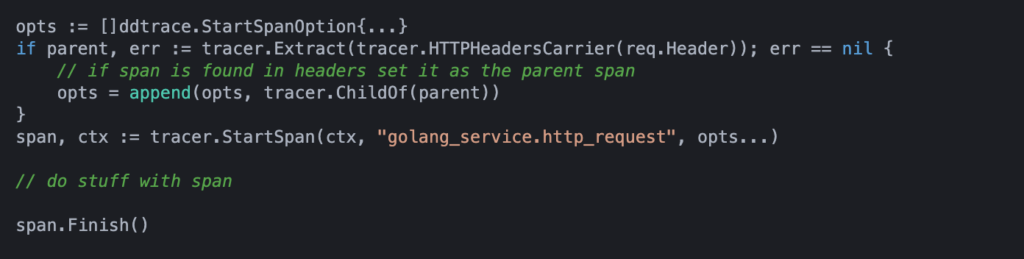
In the logic above we are using the function StartSpan instead of StartSpanFromContext. StartSpan will use only the given start span options to create the new span. StartSpanFromContext will use the given start span options but will also get further options from the given context if there are any. If the context already contains a span then that span will be used as the parent span for the newly created span. Even if the tracer.ChildOf(...) option has been set in the given options, the span from the context takes precedence and will be used as the parent, ignoring the input parent span! As we have already set the correct parent span (using tracer.ChildOf), we use StartSpan instead of StartSpanFromContext.
In the go service we can then extract the span from the request header and use the span to create child spans:
Spans can be used to track any work done and produce large traces that span (pun intended) multiple services. We have seen examples of using a span on HTTP requests, we can also create spans for database queries (Datadog library for SQL spans) or any other piece of work.
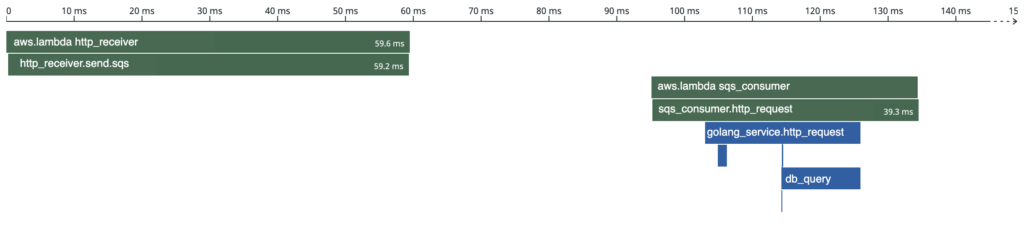
Once you have all your services and Lambdas set up to inject and extract spans you will be able to visualize all your service interactions and trace requests as they come through your system.
The final trace will include both lambda functions and the Golang service. There is a gap between the two lambda function spans, this is the time that the request spent in SQS:
Conclusion
To summarize, distributed tracing allows you to trace requests as they traverse through your services. These distributed traces produced by your services allow you to quickly troubleshoot. Only small changes to your services are required to produce distributed traces to Datadog. These small changes will have a large impact on your ability to debug your services.

.svg)
.svg)


